Understanding the Price-to-Book Ratio and Its Valuation Insight
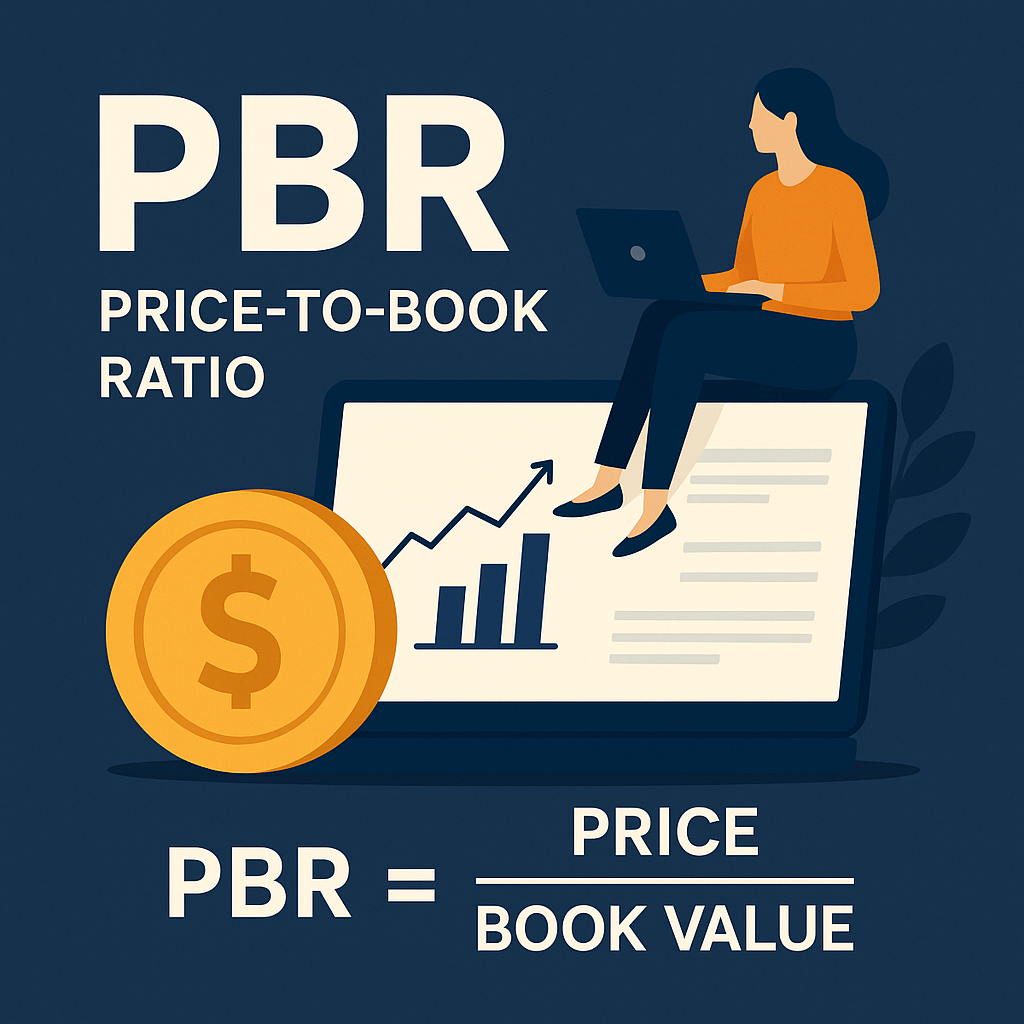
PBR (Price-to-Book Ratio) is a fundamental valuation metric that compares a company’s stock price to its book value per share.

🔹 PBR Formula
PBR = Price per Share / Book Value per Share
Where:
Book Value = Total Assets – Total Liabilities
This ratio reflects how much investors are willing to pay for each dollar of a company’s net assets. A PBR below 1.0 may suggest the stock is undervalued relative to its liquidation value.
🔎 PBR and Liquidation Value
A PBR lower than 1.0 indicates that the company is trading for less than its net assets — i.e., what shareholders might recover per share if the company were liquidated.
⚠️ However, just because a stock trades below its book value doesn’t mean it’s a buy.
Some companies trade at low PBRs for good reason — poor profitability, weak business models, or deteriorating industry conditions.
💡 PBR in the Context of the Excess Return Valuation Model
According to the excess return model, a company’s intrinsic value (V) can be expressed as:
V = Book Value (B) + Present Value of Excess Returns
or
PBR = 1 + PV of Σ (ROE – r)
where:
- ROE = Return on Equity
- r = Required Rate of Return
This means that a company’s ability to generate returns above its Required Rate of Return (r) is what justifies a PBR higher than 1.
- If ROE > r → PBR > 1 (Value creation)
- If ROE = r → PBR ≈ 1 (Fairly valued)
- If ROE < r → PBR < 1 (Value destruction)
🔄 How to Interpret High vs. Low PBR
| PBR Value | Interpretation | Action Point |
|---|---|---|
| < 1.0 | Possibly undervalued, but check quality | Examine ROE, growth, and industry health |
| ~1.0 | Likely fairly valued | Look for steady, predictable earnings |
| > 1.0 | Growth or profitability premium | Confirm if ROE sustainably exceeds |
A high PBR isn’t always overpriced — it might signal a high-quality business.
A low PBR isn’t always a bargain — it could signal fundamental risk.
📊 Historical Benchmark: S&P 500’s 20-Year PBR Trend
To provide context, here’s a snapshot of the S&P 500’s average PBR over the past 20 years.

PBR is a powerful yet often misunderstood ratio. Used in isolation, it may mislead.
But when combined with ROE and required return (r) through the excess return model, it becomes a reliable gauge of long-term value creation